China equities lead the pack as US indices lag


Premier Xi jumps in with more verbal support

It was a heady start to the trading week for Chinese equities, with the China50 index powering ahead to the biggest one-day gain since 2016. Today’s move brings the two-day advance from Friday, triggered by a three-pronged verbal commitment by Chinese officials from regulators and the central bank to support non-state linked companies, to more than 8.2%.

At the weekend, Chinese President Xi Jinping added his voice to the verbal support, saying in a letter to private entrepreneurs that the government would offer “unwavering support” for the country’s private sector, while the country’s exchanges committed to help manage share-pledge issues. Earlier this morning PBOC advisor Ma Jun said he expects policy measures to support the market.

The index has risen to test the 100-day moving average at 11,484 for the first time since October 3 while the September 28 high of 11,925 is likely to act as the next resistance point. The daily stochastics momentum indicator is still showing a bullish signal.

China50 Daily Chart

Source: Oanda fxTrade

Outside of China, the sentiment is not quite so buoyant. The Japan225 index is just 0.71% higher while the US30 index added just 0.1% and the NAS100 index gained 0.42%. Hong Kong stocks were closest to China gains, with an advance of 2.67%.

Aussie dollar underperforms

The Aussie dollar was the worst performer in the G-10 space versus the US dollar, as a weekend by-election meant the Liberal government lost a seat and thereby its governing majority, now holding 74 out of the 150 seats.

AUD/USD slid as low as 0.7087, the lowest in eleven days, before consolidating above the 0.71 handle. Previous lows near 0.7040 still offer some technical support.

AUD/USD Daily Chart

Source: Oanda fxTrade

Earlier this morning RBA Deputy Governor Debelle said he had an open mind on what constitutes full employment. His remarks come after data last week showed the unemployment rate falling to 5.0%, a 6-1/2 year low and a rate that many viewed as the full employment rate. Last week, Debelle had said that that it is possible the country’s jobless rate would have to fall further than on previous occasions before wage growth would increase at a faster pace.

A slow start to US GDP week

There’s not much to excite on the data front today, with US Chicago Fed activity index for September the only release of note. We also see Canada’s August wholesale sales. Things remain quiet until Wednesday when we see Markit flash PMIs for Germany, the Eurozone and the US. Wednesday also sees the Bank of Canada’s rate decision, where economists are evenly split whether we will get a rate hike or not. The ECB rate decision follows on Thursday but the main event is left until Friday, with the release of US Q3 GDP numbers, which are expected to slow to 3.3% y/y from Q2’s 4.2%. At 3.3%, this would still be the highest growth since Q3 2016.

US GDP Growth Historical Snapshot

Source: MarketPulse

You can view the full MarketPulse data calendar at https://www.marketpulse.com/economic-events/

China offers verbal support as growth hits lowest in nearly a decade


China to the rescue

Asian equity markets fared much better than their US counterparts did yesterday, mostly helped by comments out of China. Before the markets opened, we heard coordinated voices from the heads of China’s securities regulator (CSRC), the banking and insurance regulator and the central bank. The chief of CSRC said that China will support non-state backed listed companies, while the PBOC governor said low market valuations and market volatility are caused by investor sentiment and were not in line with China’s economic fundamentals. He added that the central bank will support financing to non-state backed firms.


China50 Daily Chart

Source: Oanda fxTrade


Investors interpreted the comments to imply official money would be flowing into the market, so the local index started off in the black, and powered ahead to gains of more than 1.8% at one stage. This filtered through Asian bourses, with the Japan225 index currently up 0.3%, the HongKong33 index gaining 1.1% and the Australia200 index adding 0.8%. The NAS100 index, the worst hit of the US indices yesterday, rose 0.2%.


China data disappoints

China recorded GDP growth of 6.5% y/y for the third quarter, below estimates of 6.6% and down from Q2’s 6.7% rate. That was the slowest rate of growth since Q1 2009, when the Global Financial Crisis was in full swing. China’s Statistics Bureau laid the blame squarely on the trade war, saying the “extremely complex and severe international situation” was a drag on growth.

In other data, industrial production slowed to +5.8% y/y in September, the weakest since February 2016, while retail sales provided the only bright spot, rising 9.2% y/y, better than the 9.0% predicted in a poll of economists, and the fastest pace in five months.

The Aussie took an initial knee-jerk dip after the GDP numbers, hitting the lowest in more than a week, but soon recovered amid the positive sentiment across equity markets. However, AUD/USD has yet to regain the 200-hour moving average at 0.7113, which has actively guided the pair over the past five sessions.


AUD/USD Hourly Chart

Source: Oanda fxTrade


Asia Market update: China data

Canada’s consumer prices on tap

Euro-zone current account data for August is the only main event on the European calendar today, which is expected to show a larger surplus of EUR21.4 billion from EUR21.3 billion in July. Consumer prices from Canada for September headline the North American session, with both the official readings and the Bank of Canada core readings due.

Watch out for speeches from Fed’s Kaplan (dove, non-voter) and Bostic (dove, voter) today, though neither is expected to deviate from the Fed’s current view on the rate path amid a strong economy. A speech from Bank of England’s Carney completes the week.

You can view the full MarketPulse data calendar at https://www.marketpulse.com/economic-events/


Have a great weekend from Asia.

Live FX Market Analysis – 16 October 2018 (Video)

It’s been another turbulent week in FX markets with last week’s sell-off suitably spooking investors, Saudi Arabia causing a stir following allegations of murder at its embassy in Turkey, Brexit talks stalling and Italy risking the wrath of the European Commission after submitting its budget. Senior Market Analyst Craig Erlam discusses all of these and more in this week’s webinar.

Craig also gives his live analysis on EURUSD (16:37), GBPUSD (18:09), EURGBP (20:05), AUDUSD (21:56), USDCAD (24:25), GBPCAD (29:37), NZDUSD (30:14), USDJPY (31:05), GBPJPY (31:50) and EURJPY (32:40).

Commodities Weekly: Gold at 2-1/2 month high as safe haven status reborn

Precious metals are on the rebound as the US dollar goes in to pause mode after recent gains, while base metals firm up on supply-side issues. Crude oil prices push higher amid geopolitical tensions while weather-related supply side issues help agricultural commodities.

Precious metals

GOLD advanced to 1,234 yesterday, its highest level since July 26, as a weaker phase for the US dollar promoted the metal’s safe haven status, while a pickup in consumer demand from India for the festive and wedding seasons also boosted the precious metal. Adding to the bid bias, IMF data released yesterday showed that Poland increased their gold holdings to a record high of 117 tonnes in September, with suspicions other central banks may have been buying too.

Gold’s rally stalled just short of the 200-week moving average at 1,235, which has capped prices for 12 weeks. Another resistance points comes in at 1,239, which is 38.2% Fibonacci retracement of the April 11 to August 16 drop.

Speculative accounts increased their net short gold positions for a fourth week, with net shorts at their highest since April 2001, according to the latest positioning snapshot as at October 9, published by CFTC.


Gold Daily Chart

Source: Oanda fxTrade


SILVER looks set to rally for the first week in three as the US dollar takes a breather after recent gains. The metal closed above the 55-day moving average for the first time since June 14 yesterday, and looks poised to advance for the fourth day in a row today. The gold/silver (Mint) ratio is holding near the middle of the recent seven-week range of 80.90 to 85.20.

Speculative accounts increased net short silver positions for the first time in five weeks, in the week to October 9, CFTC data shows.


PLATINUM rose for a second straight week last week, surging through the 100-day moving average for the first time since March 27, to reach the highest level in three months. The October 9 snapshot shows speculative investors adding to net long positions for a fifth straight week to their highest since the week of May 8, according to the CFTC data.


Platinum Daily Chart

Source: Oanda fxTrade


An association which represents platinum mining companies in Zimbabwe has pleaded with the local government to scrap hefty levies totaling more than 25%, as they threaten the local mining industry. The South African nation produces more than 400,000 ounces of the precious metal each year, making it the third largest platinum producer after South Africa and Russia.


PALLADIUM is hovering just below 8-1/2 month highs after posting gains of more than 30% in two months from August. A weaker US dollar has helped the precious metal more recently, but the initial drive came from a pickup in industrial demand.  Speculative accounts added to net long positions for a seventh week, data to October 9 from CFTC shows, with net longs now at their highest since June 12.


Base metals

Just as industrial demand for COPPER appeared to be picking up, issues on the supply side are coming to light. News from Chile, the world’s largest copper producer, has revealed that four smelters are to shut for up to 75 days amid struggles to comply with tougher emissions standards in the country by mid-December. At the same time, latest customs data shows China imported a record 1.93 million tons of copper concentrate in September, showing still robust demand despite the ongoing US-China trade wars.

Copper rose for the first time in three months last month, posting the biggest monthly gain this year. The base metal has tested the 100-day moving average on two occasions so far this month, but has failed to close above it. The metal is currently at 2.7642 with the 100-day moving average at 2.8091.


Energy

CRUDE OIL looks set for its third straight day of gains after a key 50% retracement level held last week. Saudi-US tensions have been building up on the back of the disappearance of journalist Jamal Khashoggi, with investors fearing the worst-case supply scenario if the US imposes sanctions on Saudi Arabia. Evidence of a further slowdown in Iran oil exports ahead of US sanctions being imposed on November 4 is also helping sentiment. WTI is now at $71.972 after hitting a three-week low of $70.58 last week.

Tomorrow’s release of weekly crude oil stocks as at October 12 by the EIA is expected to show a drawdown of 281,000 barrels, according to the latest survey of economists. That would be with first drawdown in four weeks following gains of 1.85, 7.98 and 5.99 million barrels respectively.


WTI Daily Chart

Source: Oanda fxTrade


NATURAL GAS prices are being lifted by the forecast of below average temperatures across eastern US in the October 20-24 period. Prices are recovering from the first down-week in four last week, and are looking to test the October high of 3.39, which in turn was the highest since January 31.


Agriculturals

WHEAT prices continue to be supported by supply-side issues, mostly as a result of weather conditions. A report by the European Commission estimates that EU wheat shipments are down about 23% on-year during the current season started July 1. In addition, news that record-low temperatures across the US western Great Plains is raising fears about crop damage, while reports that dry weather in northern China may hurt wheat planting, are all implying that the supply side is looking a bit shaky.

Wheat is now at 5.11, holding just below the 55-day moving average at 5.13, which has capped prices since September 11.


SUGAR is being boosted predominantly by events in Brazil. Firstly, recent reports suggest Brazil’s sugar production will be lower this year than last, with the outlook for next year also lower. Secondly, the government’s shift in its gasoline pricing policy has made ethanol more attractive, and hence seen as lifting demand for sugar. Thirdly, the local Real currency has rebounded versus the US dollar making exports more expensive.

Sugar looks poised to advance for the third week in a row and is currently testing the 55-week moving average, an average that has capped the commodity on a closing basis since late-February. Sugar is now at 0.1250, the same as the 55-week moving average, and has rallied more than 27% from the August low.


Sugar Weekly Chart

Source: Oanda fxTrade


CORN touched the highest in four months yesterday, buoyed by the latest USDA crop report released Thursday, which showed a lower estimate for US crop yields. Corn prices opened above the 200-day moving average for the first time since August 17 yesterday, powering higher to reach 3.683, the highest since June 14. The commodity is currently at 3.662, with the 200-day moving average at 3.621 and the 200-week moving average at 3.617.


SOYBEANS traded above the 100-day moving average for the first time since June 4 yesterday, posting its biggest one-day gain since August 16, as weather-related issues affected the supply side. Wet weather across the US Midwest has raised crop quality concerns while it is also too early to estimate the overall impact hurricane Michael has had on crops.

The commodity is at 8.823, hovering near two-month highs, but is currently down on the day for the first time in four days. The 100-day moving average is at 8.718.

Elliott waves analysis – Wait for a possible buy around 112.195.

USDJPY - Down

Wave Analysis:
On this chart, we’re seeing a weekly support at 112.195. We expect the bounce from 112.195 to have marked an end to the corrective wave (iv), that any clear move to the upper side will be unfolding of the last impulsive wave (5) to the upper side and should break above 114.197 towards 118.795 or even higher. This view can only be invalidated in case the price break below 112.195, if this is the case, then we’ll expect an acceleration to the lower side with an ultimate target at 108.531.
Trade Recommendations:
Wait for a possible buy around 112.195.

101% Double the volume

!Attention!
All bonus participates in drawdown!

FreshForex cancels commissions!

You may check other analytical reviews on FreshForex website. Source: freshforex.com.

Elliott waves analysis – Sell the cable from 1.33042.

GBPUSD - Flat

Sell the cable from 1.33042.

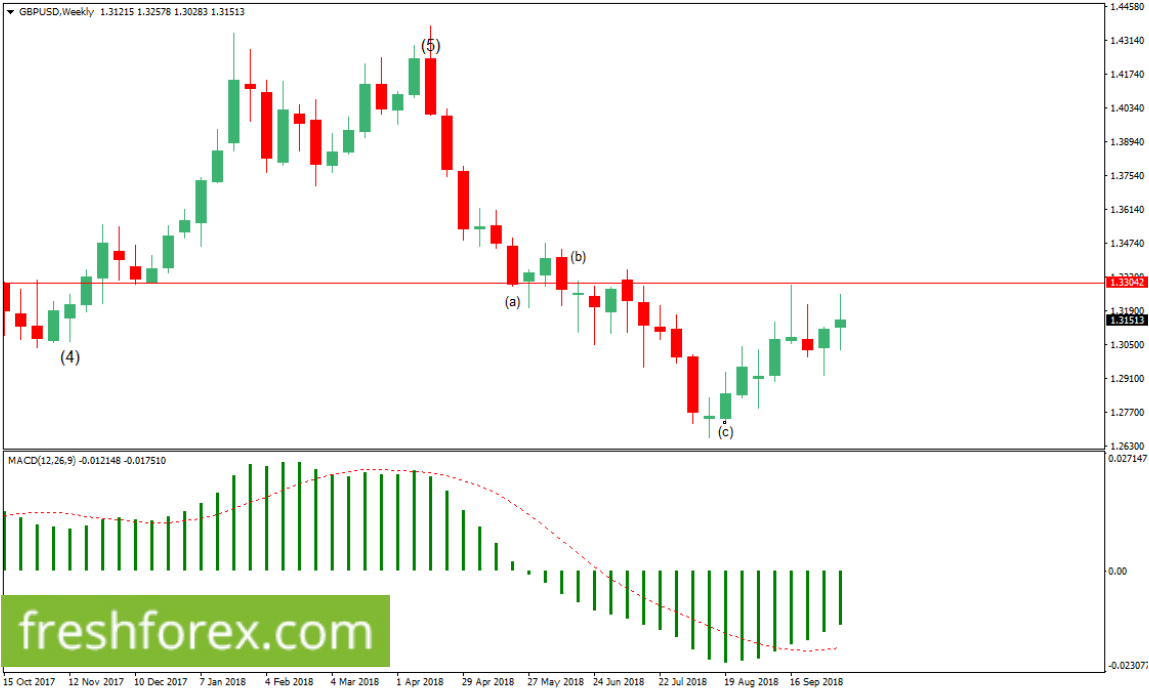
Wave Analysis:

On this chart, there’s a key resistance around 1.33042. We expect the price to rise towards this resistance so that we can pick a low risk sell opportunity towards 1.27700 or even lower. Should the price break above 1.33042, then we’ll wait for a retracement to the just broken line to pick a low risk buy opportunity with an ultimate target at 1.43140. If you’re not already in a buy position, you could place a pending sell limit order at 1.33042 with your stop loss slightly higher.

Trade Recommendations:

Sell the cable from 1.33042.

101% Double the volume

!Attention!
All bonus participates in drawdown!

FreshForex cancels commissions!

You may check other analytical reviews on FreshForex website. Source: freshforex.com.

Elliott waves analysis – As long as the price is above 1.14626, we expect a possible momentum to the upper side.

EURUSD - Up

As long as the price is above 1.14626, we expect a possible momentum to the upper side.

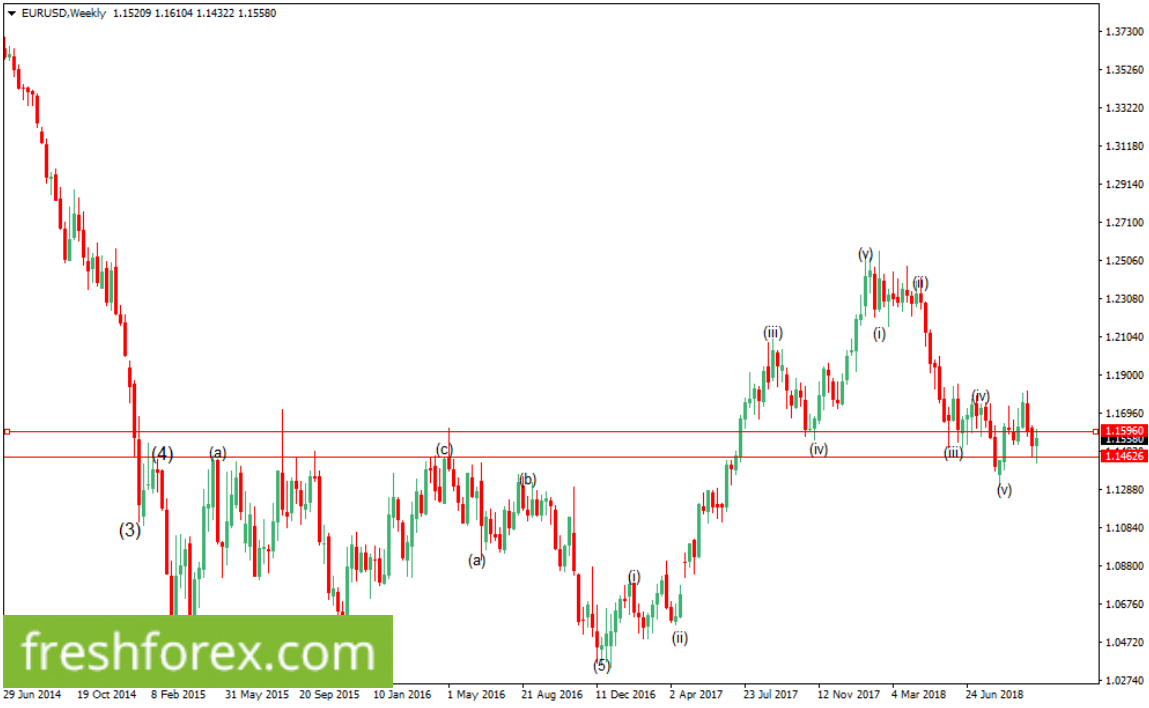
Wave Analysis:
Currently the price is above a weekly support level 1.14626. AS long as the price is above this level, we expect a possible momentum to the upper side. The anticipated bullish price rally is the unfolding of an impulsive wave count to the upper side and should break above 1.1900 towards 1.25060. This view can only be invalidated in case the price breaks below 1.14626, if this is the case, then a momentum towards 1.04720 or even lower is expected, the expected downward rally is the continuation of the impulsive wave (v) further to the lowerside.
Trade Recommendations:
As long as the price is above 1.14626, we expect a possible momentum to the upper side.

101% Double the volume

!Attention!
All bonus participates in drawdown!

FreshForex cancels commissions!

You may check other analytical reviews on FreshForex website. Source: freshforex.com.

Weekly analytics- Elliott waves analysis – Gold Correcting itself upwards

SPX500 Weekly Review

Gold Correcting itself upwards

Wave Analysis:
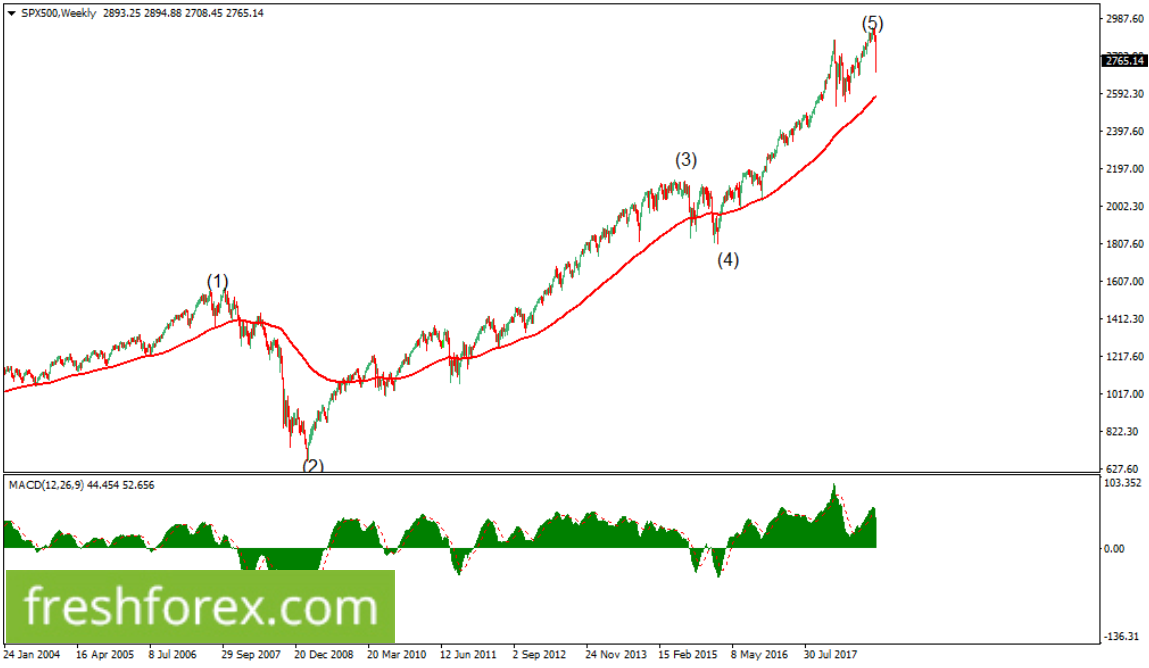
During the previous week, SPX500 lost value considerable and is still pretty much bearish both on the daily and the weekly charts. According to the two indicators, As long as the price remains above the 52 Simple moving average and the columns of MACD above 0.00, we expect nothing but a possible momentum to the upper side.  Currently as it is on the weekly charts, we expect further correction to the lower side but should not go beyond the moving average.
Trade Recommendations:
We’re still bullish 


Gold Weekly Review
Gold Correcting itself upwards
 
Wave Analysis:
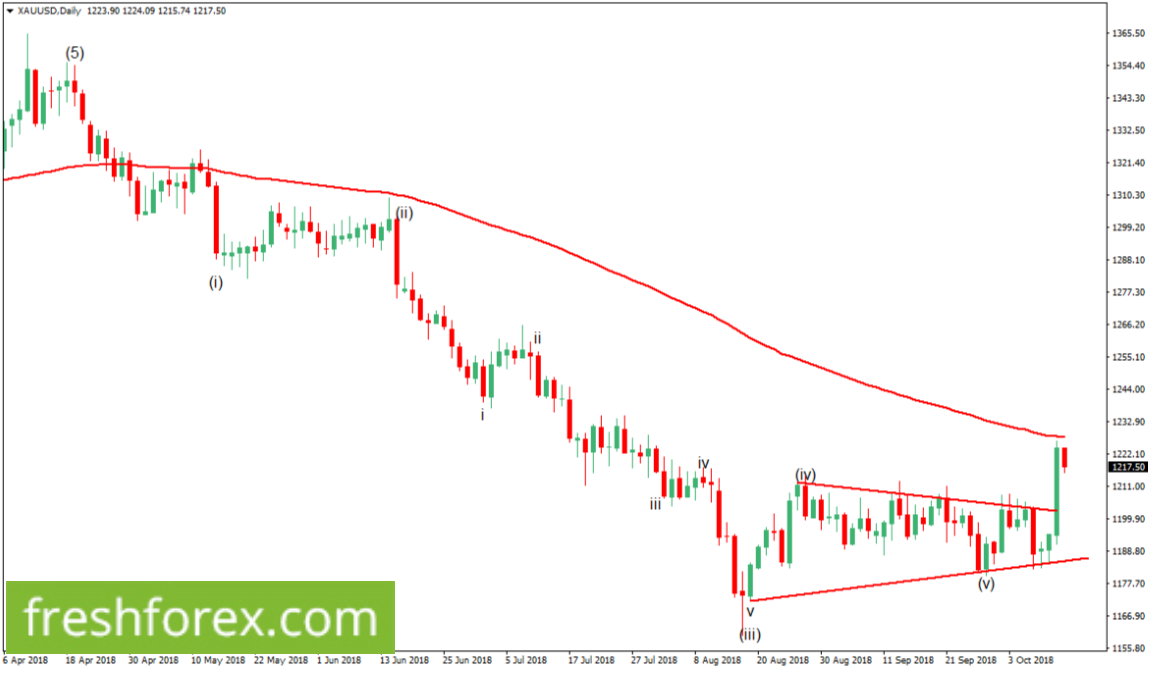
During the previous week,  Gold markets rose instead of rallying to the lower side but is still below the upper Moving Average, As long as the price remains below this trend line, we expect nothing but a possible momentum to the lower side. The current bullish price rally is the unfolding of a bullish correction and should not break above the upper trend line. As it is on the  daily chart, while the price is below the upper SMA, we expect nothing but a possible momentum to the lower side.
Trade Recommendations:
Wait.
Oil Weekly Review
Gold Correcting itself upwards
Wave Analysis:
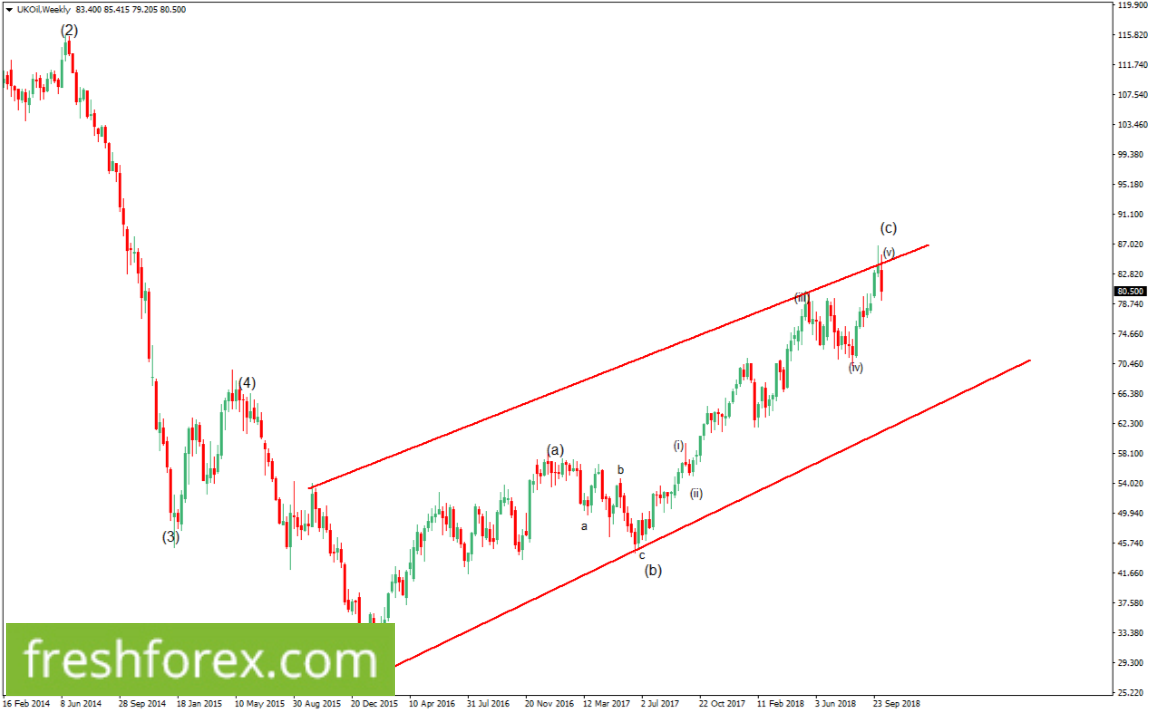
Following a bearish pin bar candle seen a fortnight ago, Oil lost value considerable and is still pretty much bearish both on the daily and the weekly charts. As long as the price is contained below the upper resistance trendline, we expect nothing but a possible momentum to the lowerside with an ideal target along the lower supportive trendline. You may still look for short position now and have your take profit at 78. A break below this target may push the price further to the lowerside.
Trade Recommendations:
We’re short.

101% Double the volume

!Attention!
All bonus participates in drawdown!

FreshForex cancels commissions!

Forex Technical Analysis: Trend potential – Wait for a correction to 1.1823-1.1802

EURUSD - Up

Wait for a correction to 1.1823-1.1802

Technical observation

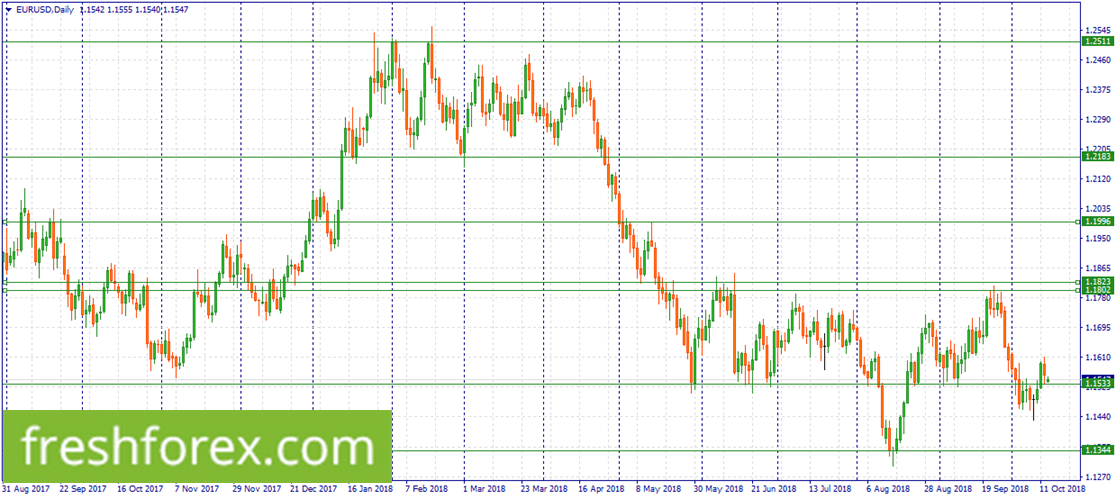
After the breakout above the line 1.1539, EUR rose with one candle then retraced up to the just broken line. Right now it is rising and I expect a rally to 1.1823-1.1802 and a rejection within it for possible bearish momentum towards 1. 1539 and in case of a breach below it,remain short towards 1.1344.Should there be a rise to the zone and a clear breakout above it with a big green candle, wait for a correction to it confirming possible bullish momentum of price before you pick long position with your ideal target at 1.1996 or even higher to 1.2183.Right now, short term traders can pick long position towards 1.1823-1.1802.

Technical levels

Resistance levels

R1.1.1602

R2.1.1645

R3.1.1721

Pivot

1.1568

Support levels

S1.1.1526

S2.1.1492

S3.1.1415

Trade signal

Wait for a correction to 1.1823-1.1802 to sell EUR/USD.

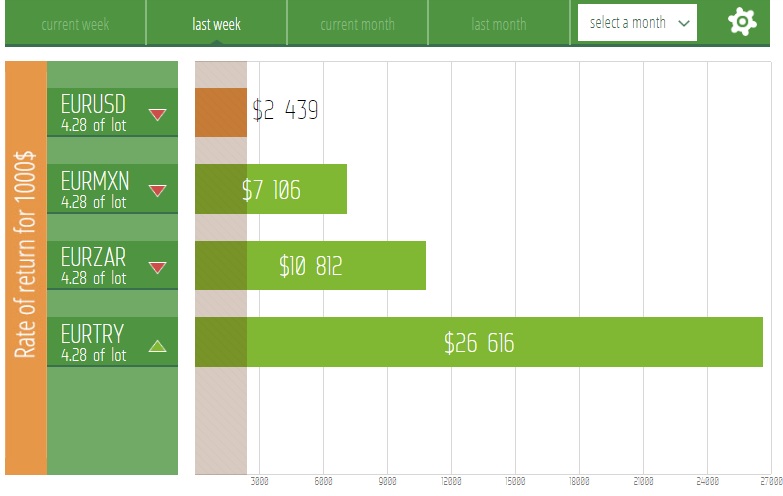
Do you know against which currencies EUR is the most profitable?

Wait for a correction to 1.1823-1.1802

More trading assets here…

You may check other analytical reviews on FreshForex website. Source: freshforex.com.

Weekly analytics- Forex Technical Analysis: Trend potential – Sell #ASX at 6130.0

#ASX weekly

Sell #ASX at 6130.0

Technical observation

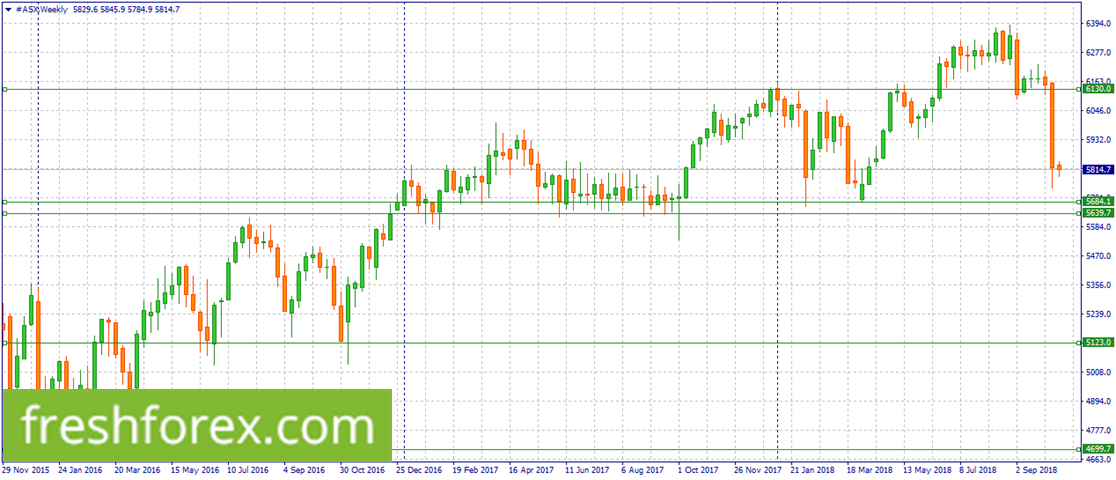
Last week,#ASX went down below a supportive key line 6130.0 with a big red candle, it rallied steadily towards the key supportive zone 5684.1-5639.7 but could not reach it and is still showing signs of declining towards it.This week’s candle opened below  6130.0 and is declining towards the zone, I expect a rally to 5684.1-5639.7 and a rejection within followed by  a correction to 6130.0 for possible bearish momentum towards 5684.1-5639.7 and  a possible breakout below it for  a further decline in price towards 5123.0 or even further down to 4699.7.Wait for  a correction to 6130.0 to sell #ASX with your target at 5684.1.

Trade signal

Sell #ASX at 6130.0 with your take profit at 5684.1 and stop loss around 6329.2.

                               Brent weekly

Sell #ASX at 6130.0

Technical observation

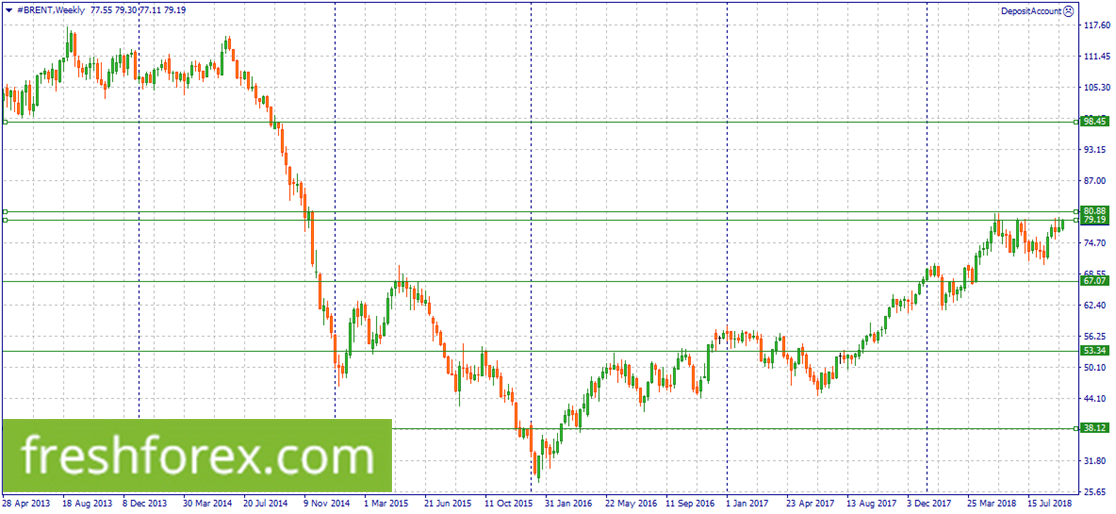
Brent is approaching the resistance zone 80.88-79.19, I expect either a rejection of it within the zone followed by bearish momentum towards the support 67.07 and a breakout below it for a further decline towards 53.34, or, a clear breakout above 80.88-79.19 with a big green candle followed by a correction to it for possible bullish momentum towards the resistance line 90.45 and a possible breach above it for a further rise. I would advise you remain flat temporarily and wait for a close within 80.88-79.19, or a breach above it to trade Brent. On your way downwards the key lines to look for include; 67.07, 53.34 and 38.12.

Trade signal                                            

Remain flat temporarily.

                 WTI weekly

Sell #ASX at 6130.0

Technical observation

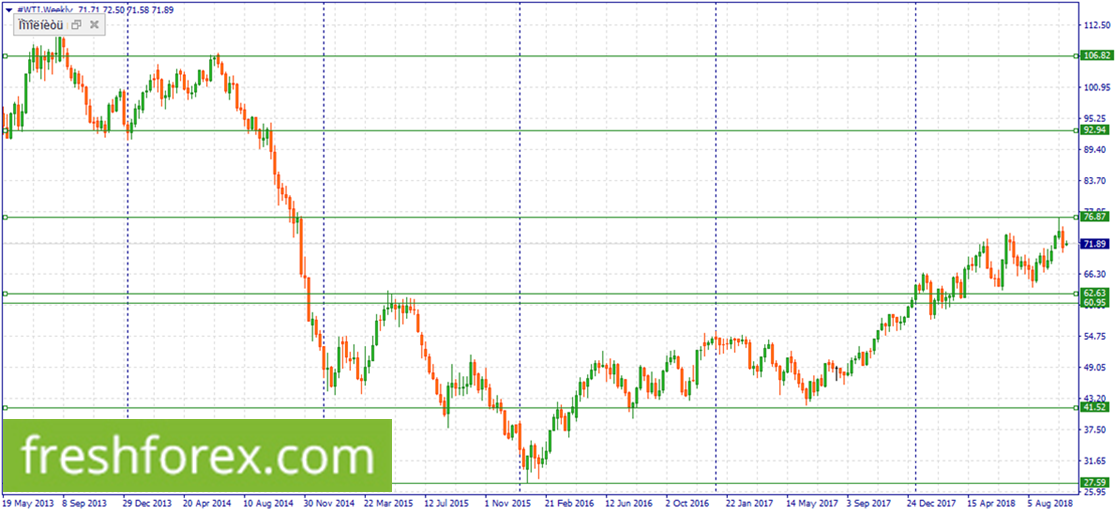
#WTI was rejected at the resistance line 76.87 then rallied down towards 62.63-60.95 but could not reach it. Currently it is pulling back to 76.87 and I expect nothing but a rejection of it at the line followed by bearish momentum towards 62.63 and  a breach below it for  a further decline towards 41.52.Right now I’m waiting for the correction to 76.87 to pick short position at it with my take profit at 62.63 and stop loss slightly above 76.87.Should there be a breach above 76.87 with  a big green candle, wait for a correction to it confirming possible bullish momentum of #WTI before you pick long position towards 92.94.

Trade signal

Wait for  a correction to 76.87 to sell Light sweet crude oil.

Do you know against which currencies CFD is the most profitable?

Sell #ASX at 6130.0

More trading assets here…