A nervous beginning to the start of the week

Monday October 22: Five things the markets are talking about

Global equities remain better supported this Monday morning after Chinese stocks surged overnight on senior officials verbal intervention.

The ‘mighty’ U.S dollar has eased a tad along with treasuries, while Italian bonds have rallied.

The EUR had found some early support on the back of a ratings decision by Moody’s Investors Service late last Friday who removed the immediate threat of a downgrade to ‘junk.’ The market now awaits on S&P’s review this Friday.

Nevertheless, risks remain, from tension surrounding the Khashoggi murder and the ongoing Sino-U.S trade showdown to Italian budget fears and President Trump’s unpredictability ahead of U.S midterm elections.

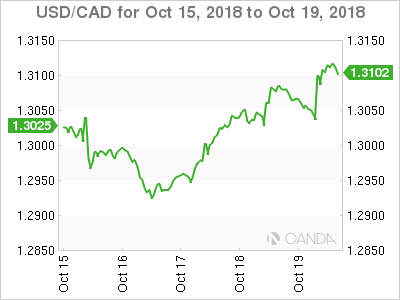
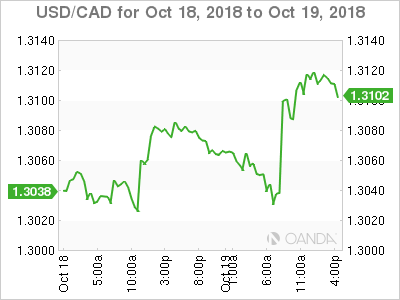
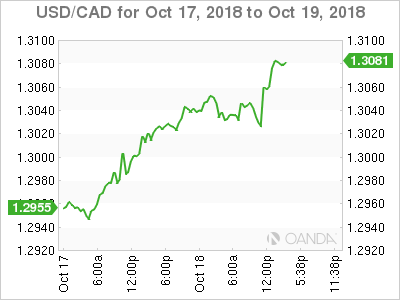
On tap for this week, the Bank of Canada (BoC) is expected to increase its policy rate by +25 bps to +1.75% on Wednesday (Oct 24) despite last Friday’s disappointing inflation and retail sales readings.

Elsewhere, the European Central Bank (ECB) is expected to leave policy unchanged, but questions regarding Italy and its budget issues are expected to be front and center.

In Scandinavia, Sweden’s Riksbank and Norway’s Norges bank take center stage mid-week.

Stateside, earnings season gathers pace with notable highlights including Amazon, Alphabet, Intel, Verizon, Microsoft, Twitter, McDonald’s, and Caterpillar.

1. Stocks in the black

Japan’s Nikkei edged higher, supported by a rally in Chinese stocks on the promise of additional stimulus measures, triggering buying in firms exposed to China. The Nikkei share average rallied +0.37%, moving off a six-week low hit during last Friday’s session. The index is now down around -7.5% since hitting a 27-year high on Oct. 2. The broader Topix edged +0.15% higher.

Down-under, Aussie stocks ended lower on Monday, as political concerns rattled investors after the governing coalition looks set to lose its one-seat majority in parliament following a weekend by-election. The S&P/ASX 200 index closed -0.6% lower. In S. Korea, the Kospi stock index climbed on Monday supported by a strong Chinese market. The index rallied +0.5%.

In China, stocks surged overnight in the wake of coordinated statements of support by senior regulators, and as China prepares to overhaul its income tax law for individuals. The benchmark Shanghai Composite index was +4.2% higher, while the blue-chip CSI300 index jumped +4.4%.

The gains extended to Hong Kong, where the Hang Seng index added +2.3% and the China Enterprises Index ended +2.6% higher.

In Europe, indices trade higher across the board. Italy’s FTSE MIB outperforms after Moody’s cut the countries rating to the lowest investment grade, but put the outlook as stable, helping BTP futures rally.

U.S stocks are set to open in the ‘black’ (+0.1%).

Indices: Stoxx600 +0.22% at 362.02, FTSE +0.26% at 7,066.00, DAX +0.52% at 11,614.01, CAC-40 +0.24% at 5,096.82, IBEX-35 +0.73% at 8,957.30, FTSE MIB +0.66% at 19,205.50, SMI +0.30% at 8,892.50, S&P 500 Futures +0.18%

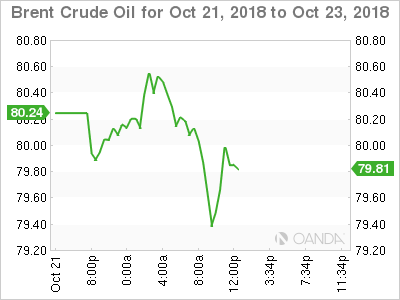
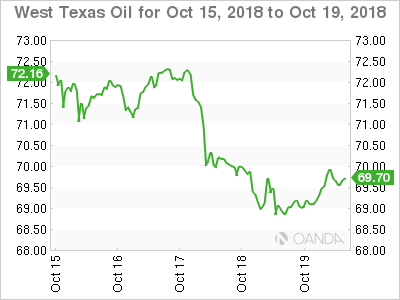
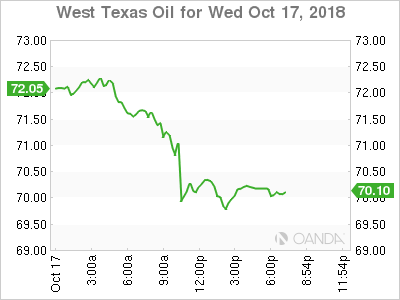
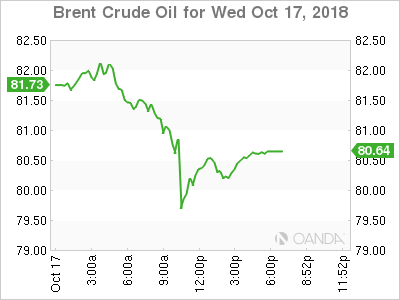
2. Brent oil back above $80 as Iran sanctions loom

Brent crude oil prices remain better bid as markets are expected to tighten once U.S sanctions against Iran’s crude exports come into effect in November.

Brent crude oil futures are at +$80.26 a barrel, up +48c, or +0.6%, above Friday’s close. U.S West Texas Intermediate (WTI) crude futures are at +$69.60 a barrel, up +48c, or +0.7%.

Note: The U.S sanctions on Iran, the third-largest producer in OPEC, are set to start on Nov. 4.

OPEC agreed in June to boost supply to make up for the expected shortfall in Iranian exports, however, recent data suggests that OPEC is struggling to add barrels as an increase in Saudi supply was offset by declines elsewhere.

Nevertheless, relief may come from the U.S, where offshore drillers added four oilrigs in the week to Oct. 19, bringing the total count to 873, according to Baker Hughes data on Friday. After months of stagnation, U.S crude production is expected to rise.

However, undermining sentiment is weaker China growth data and the ongoing Sino-U.S trade dispute. The full impact of the trade war is expected to hit markets early next year and provide a considerable drag on oil demand.

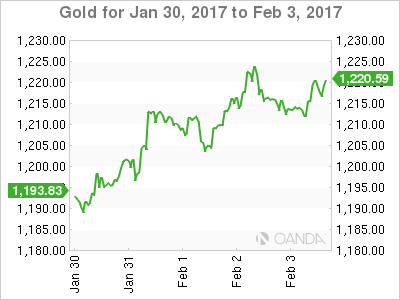
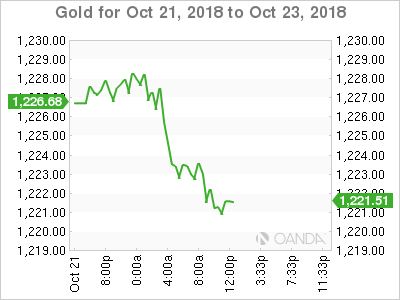
Ahead of the U.S open, gold prices have edged higher overnight towards their three-month peak hit last week, as the ‘big’ dollar eased and worries over rising political tensions slowing global economic growth lent support to the ‘yellow’ metal. Spot gold is up +0.1% at +$1,226.52 an ounce, while U.S. gold futures are also up +0.1% at +$1,229.50 an ounce.

3. Italian yields drops by most in 4-months on Moody’s decision

Italian sovereign yields dropped across the curve after ratings agency Moody’s kept the country’s sovereign ratings outlook ‘stable’ while delivering an expected downgrade last week. The market was worried that the outlook would be ‘negative.’

Note: S&P’s review is expected this Friday (Oct 26). It now rates the country two notches above junk at BBB.

Italy’s five-year BTP yield dropped -36 bps to a two-week low of +2.63%, while the benchmark 10-year yield was -26.5 bps lower at +3.39%, its biggest daily drop in four-months. The BTP/Bund 10-year yield spread tightened to +284 bps.

Elsewhere, the yield on the U.S 10-year note rose +1 bps to +3.20%, while Germany’s 10-year Bund yield increased + 2bps to +0.48%. In the U.K, the 10-year Gilt yield climbed +1 bps to +1.588%.

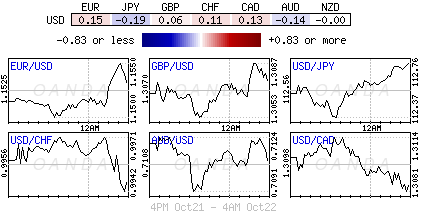
4. Dollar quiet across the board

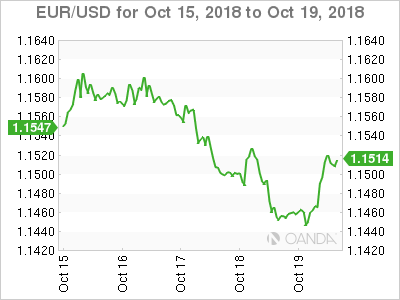
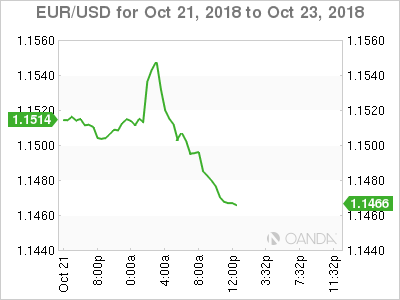
The EUR/USD is a tad lower at €1.1515 after testing a high of €1.1550 overnight on the back of a relief rally in the 10-year BTP/Bund spread. Nevertheless, event risk persists ahead of the deadline for Italy to respond to the E.U Commission’s initial objections over the 2019 budget plan.

Expect Thursday’s ECB meeting to be closely watched, especially Draghi’s press conference, where the market is looking for more color on how the ECB would reinvest maturing QE proceeds post December this year.

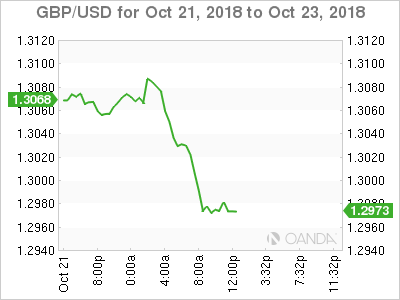
GBP/USD is -0.3% lower at £1.3030 as Brexit talks again reached an impasse. However, PM Theresa May believes that +95% of the Brexit withdrawal deal is “now settled.” It’s believed that the PM is facing a rebellion by more than 40 Tory MP’s if she does not back down to fresh demands from Brexiteers’

Note: 48 votes are necessary for a leadership challenge

5. Italy says it’s ready to discuss budget with E.U authorities

The Italian government is ready to sit and discuss its budget targets with E.U, Deputy Prime Minister Luigi Di Maio said this morning, restating that the “populist” coalition had no plan to leave the euro.

Italy has sent a letter to the commission explaining its reasons for sticking to the +2.4% goal, and that the government was ready to “sit at the table”.

Note: Italy wants to hike its budget deficit to +2.4% from this year’s +1.8%. Last week, the E.U Commission labeled Italy’s 2019 draft budget an “unprecedented breach of EU fiscal rules.”

Forex heatmap

China equities lead the pack as US indices lag


Premier Xi jumps in with more verbal support

It was a heady start to the trading week for Chinese equities, with the China50 index powering ahead to the biggest one-day gain since 2016. Today’s move brings the two-day advance from Friday, triggered by a three-pronged verbal commitment by Chinese officials from regulators and the central bank to support non-state linked companies, to more than 8.2%.

At the weekend, Chinese President Xi Jinping added his voice to the verbal support, saying in a letter to private entrepreneurs that the government would offer “unwavering support” for the country’s private sector, while the country’s exchanges committed to help manage share-pledge issues. Earlier this morning PBOC advisor Ma Jun said he expects policy measures to support the market.

The index has risen to test the 100-day moving average at 11,484 for the first time since October 3 while the September 28 high of 11,925 is likely to act as the next resistance point. The daily stochastics momentum indicator is still showing a bullish signal.

China50 Daily Chart

Source: Oanda fxTrade

Outside of China, the sentiment is not quite so buoyant. The Japan225 index is just 0.71% higher while the US30 index added just 0.1% and the NAS100 index gained 0.42%. Hong Kong stocks were closest to China gains, with an advance of 2.67%.

Aussie dollar underperforms

The Aussie dollar was the worst performer in the G-10 space versus the US dollar, as a weekend by-election meant the Liberal government lost a seat and thereby its governing majority, now holding 74 out of the 150 seats.

AUD/USD slid as low as 0.7087, the lowest in eleven days, before consolidating above the 0.71 handle. Previous lows near 0.7040 still offer some technical support.

AUD/USD Daily Chart

Source: Oanda fxTrade

Earlier this morning RBA Deputy Governor Debelle said he had an open mind on what constitutes full employment. His remarks come after data last week showed the unemployment rate falling to 5.0%, a 6-1/2 year low and a rate that many viewed as the full employment rate. Last week, Debelle had said that that it is possible the country’s jobless rate would have to fall further than on previous occasions before wage growth would increase at a faster pace.

A slow start to US GDP week

There’s not much to excite on the data front today, with US Chicago Fed activity index for September the only release of note. We also see Canada’s August wholesale sales. Things remain quiet until Wednesday when we see Markit flash PMIs for Germany, the Eurozone and the US. Wednesday also sees the Bank of Canada’s rate decision, where economists are evenly split whether we will get a rate hike or not. The ECB rate decision follows on Thursday but the main event is left until Friday, with the release of US Q3 GDP numbers, which are expected to slow to 3.3% y/y from Q2’s 4.2%. At 3.3%, this would still be the highest growth since Q3 2016.

US GDP Growth Historical Snapshot

Source: MarketPulse

You can view the full MarketPulse data calendar at https://www.marketpulse.com/economic-events/

US Growth in Q3 to Guide Dollar

The US dollar is mixed on Friday. Investor’s appetite for risk rose and safe haven currencies (JPY and CHF) fell while positive China and Brexit news saw the NZD, EUR, GBP and AUD advance against the USD. The Canadian dollar was dragged down in the last trading day of the week after softer than expected retail sales and inflation data. Next week’s Bank of Canada (BoC) monetary policy meeting is anticipated to bring a 25 basis point rate hike. Despite the miss inflation has been above the central bank’s target and businesses are optimistic about strong sales.

  • BoC expected to hike interest rate to 1.75%
  • German Business Climate to cool down
  • US first estimate of Q3 GDP to confirm solid growth

Euro Caught Between Brexit and Italian Budget

The EUR/USD fell 0.41 percent in the last five days. The single currency is trading at 1.1510 after rising on Friday due to a combination of softer US housing data and positive Brexit News. The gradual pace of rate lifts by the U.S. Federal Reserve had a negative impact on previously owned homes in September.


The euro rallied on Friday after a report that Theresa May’s government is ready to drop the time limit demand on the Irish border. The EU and the UK are said to be close to a deal, 90 percent by the estimate of the EU’s top negotiator, but the final 10 has proven hard to agree on.

Italian budget issues continue to drag on the euro. The threat of a downgrade of Italian debt does not seem to faze local politicians that are ready to square off against Brussels.

The European Central Bank (ECB) will publish its main refinancing rate and host a press conference on Thursday, October 25. No changes are expected, but investors need to be aware of the tone of the press conference as Mario Draghi could push a more dovish rhetoric.

Loonie to get BoC Rate Hike Boost

The USD/CAD fell 0.74 percent in a weekly basis. The currency pair is trading at 1.3117 and will look at the Bank of Canada (BoC) for support. The central bank is highly anticipated to announce a 25 basis points interest rate hike. The central bank has lifted rates twice in 2018 and rising inflation is forcing the hand of the BoC.


Canadian dollar weekly graph October 15, 2018

The rate decision has been priced in for some time, but the fundamental picture has worsened reducing the probabilities of a rate hike while still at near 80 percent. The NAFTA renegotiation was a big risk keeping the BoC awake at night, and with the USMCA some of that risk is lifted.

With inflation data lower than forecasted it now validates the gradual approach of the BoC and unless there is hawkish rhetoric from Governor Poloz, the loonie will continue to underperform against the USD.

Oil Drops as US Weekly Buildup Pressures Prices

West Texas Intermediate lost 0.95 percent this week. WTI is trading at $69.36 after staring a rebound on Friday due to surging Chinese demand. Supply concerns continue to guide daily price action. The US weekly inventories showed a buildup last week and pushed prices lower. Iranian exports have been cut ahead of the start of US sanctions, but there are reports that OPEC and other major producers are already closing the gap.


Saudi Arabia is embroiled in a diplomatic scandal and is quickly losing the goodwill it gained for having engineered price stability with the production cut agreement. The OPEC and major producers agreed to limit output to stop the free fall in energy prices and have extended the agreement to this year.

Trade war concerns eased on Friday as China and the US have agreed to meet during the sidelines of the G20 meeting in Buenos Aires. The leaders of the two nations will fly in a day ahead of the event to try and mend the trade relationship.

Gold Rises for Third Week Straight

Gold rose 0.6 percent last week. The yellow metal is trading at $1,229.40 despite gradual rate hike talk by Fed members and the minutes form the September FOMC. The rebound of the stock market correlated with the rise of the yellow metal. Safe haven appetite in gold holdings has returned and in a market with no shortage of geopolitical risk for the remainder of the year the yellow metal is set to continue on its rise.


Market events to watch this week:

Wednesday, October 24
10:00am CAD BOC Monetary Policy Report
10:00am CAD BOC Rate Statement
10:00am CAD Overnight Rate
11:15am CAD BOC Press Conference
Thursday, October 25
7:45am EUR Main Refinancing Rate
8:30am EUR ECB Press Conference
8:30am USD Core Durable Goods Orders m/m
Friday, October 26
8:30am USD Advance GDP q/q

*All times EDT
For a complete list of scheduled events in the forex market visit the MarketPulse Economic Calendar

CAD plummets on disappointing retail sales and weak inflation

Canadian inflation slowed significantly last month as temporary factors that lifted the cost of gas and air travel dissipated.

Canada’s CPI climbed +2.2% y/y, following a +2.8% increase in August and a +3% climb in July.

The market was looking for a solid +2.7% gain in September.

On a month-over-month basis, CPI declined -0.4%.

Digging deeper, the Bank of Canada (BoC) three preferred measures supporting inflation also weakened - core-inflation prices rose in a range from +1.9% to +2.1% for an average of +2.0%, down from the previous month’s +2.1% average.

Despite this morning miss, the headline annual inflation rate in Canada has come in +2%+ for eight consecutive month.

Canada retail sales miss

Canadian retail sales fell unexpectedly in August, led mostly by gas stations receipts declines.

Canada retail sales fell -0.1% in August, m/m, to a seasonally adjusted +C$50.76B. The market was looking for a +0.3% rise.

In volume terms, retail sales declined by a steeper -0.3% in August.

The previous month’s data were revised downward, and indicated receipts rose +0.2% vs. +0.3% estimate.

On the release, the CAD came under immense, trading at C$1.3030 before the headlines to C$1.3116.

Next up, the BoC monetary policy announcement is next Wednesday (Oct 24). Despite a weaker retail sales and inflation, the market is currently pricing in another +25 bps hike by Governor Poloz.

China offers verbal support as growth hits lowest in nearly a decade


China to the rescue

Asian equity markets fared much better than their US counterparts did yesterday, mostly helped by comments out of China. Before the markets opened, we heard coordinated voices from the heads of China’s securities regulator (CSRC), the banking and insurance regulator and the central bank. The chief of CSRC said that China will support non-state backed listed companies, while the PBOC governor said low market valuations and market volatility are caused by investor sentiment and were not in line with China’s economic fundamentals. He added that the central bank will support financing to non-state backed firms.


China50 Daily Chart

Source: Oanda fxTrade


Investors interpreted the comments to imply official money would be flowing into the market, so the local index started off in the black, and powered ahead to gains of more than 1.8% at one stage. This filtered through Asian bourses, with the Japan225 index currently up 0.3%, the HongKong33 index gaining 1.1% and the Australia200 index adding 0.8%. The NAS100 index, the worst hit of the US indices yesterday, rose 0.2%.


China data disappoints

China recorded GDP growth of 6.5% y/y for the third quarter, below estimates of 6.6% and down from Q2’s 6.7% rate. That was the slowest rate of growth since Q1 2009, when the Global Financial Crisis was in full swing. China’s Statistics Bureau laid the blame squarely on the trade war, saying the “extremely complex and severe international situation” was a drag on growth.

In other data, industrial production slowed to +5.8% y/y in September, the weakest since February 2016, while retail sales provided the only bright spot, rising 9.2% y/y, better than the 9.0% predicted in a poll of economists, and the fastest pace in five months.

The Aussie took an initial knee-jerk dip after the GDP numbers, hitting the lowest in more than a week, but soon recovered amid the positive sentiment across equity markets. However, AUD/USD has yet to regain the 200-hour moving average at 0.7113, which has actively guided the pair over the past five sessions.


AUD/USD Hourly Chart

Source: Oanda fxTrade


Asia Market update: China data

Canada’s consumer prices on tap

Euro-zone current account data for August is the only main event on the European calendar today, which is expected to show a larger surplus of EUR21.4 billion from EUR21.3 billion in July. Consumer prices from Canada for September headline the North American session, with both the official readings and the Bank of Canada core readings due.

Watch out for speeches from Fed’s Kaplan (dove, non-voter) and Bostic (dove, voter) today, though neither is expected to deviate from the Fed’s current view on the rate path amid a strong economy. A speech from Bank of England’s Carney completes the week.

You can view the full MarketPulse data calendar at https://www.marketpulse.com/economic-events/


Have a great weekend from Asia.

ADP Canada: Employment increased in September

Employment in Canada increased by 28,800 jobs from August to September according to the September ADP® Canada National Employment Report. Broadly distributed to the public each month, free of charge, the ADP Canada National Employment Report is produced by the ADP Research Institute®. The report, which is derived from actual ADP payroll data, measures the change in total nonfarm payroll employment each month on a seasonally-adjusted basis.

“The labor market was quite strong in the month of September,” said Ahu Yildirmaz, vice president and co-head of the ADP Research Institute. “Although the goods producing sector struggled this month, we saw significant growth in many industries. Trade, for example, continued its steady growth adding the most jobs the sector has seen all year.”

The August total of jobs added was revised up from 13,600 to 42,700.

Read more Newswire

Aussie gains as unemployment hits 6-1/2 year low


Unemployment lowest since 2012

While the headline number of jobs Australia added in September was a disappointment, it was the details and the accompanying unemployment data that stirred Aussie bulls. Australia added a mere 5,600 jobs last month, the least in two months, but the breakdown showed that 20,300 full-time jobs were added versus a loss of 14,700 part-time ones. The unemployment rate fell to 5.0%, the lowest since April 2012, though this could be partly explained by a drop in the participation rate to 65.4% from 65.7%.

AUD/USD Daily Chart

Source: Oanda fxTrade

Nevertheless, investors looked at the more positive aspects of the data stream and bid up the Aussie. AUD/USD rose as much as 0.39% to 0.7137 and is currently sitting at 0.7137. The FX pair faces a couple of resistance points at the 55-day moving average at 0.7226 and a downward-sloping trendline from August 21 at 0.7238. Stochastics momentum indicators are giving bullish signals.

USD/CNH straining at the leash

The fact that the US did not label China as a currency manipulator in its latest currency report has been taken as a green light for yuan bears to re-test the limits. USD/CNH is up 0.29% at 6.9335, nearing last week’s high of 6.9435 with ultimately eyes on August’s 19-month high of 6.9593. Once again, a slight bid tone to the US dollar as yields tick higher can be seen as justification for the firmer USD/CNH rate.

Asia market update: a busy session is unfolding

In other China news, China policy adviser and former PBOC member Fan Gang has said China would never sell off its US Treasury holdings to hit back at the US during the trade tariff war. He cautioned that the trade war would advance into the financial realm if China ever considered doing this, and believes it would hurt China more than the US.

Is weak UK CPI the result of soft retail sales?

The highlight on today’s European data calendar will likely be the UK’s retail sales for September. Recall yesterday consumer prices were below forecast during the same month and could imply slow sales. Estimates are for sales to have fallen by 0.4% m/m last month though are seen rising 3.6% on an annualized basis.

German wholesale prices are also scheduled together with Swiss trade numbers. The US calendar has no tier-1 data listed, with only the Philadelphia Fed index and weekly jobless claims slated. Fed’s Bullard and Quarles are due to speak.

You can view the full MarketPulse data calendar at https://www.marketpulse.com/economic-events/

Crude Oil Drops after Surprise US Weekly Buildup

Oil prices fell on Wednesday after the release of the US weekly crude inventories. The report by the Energy Information Administration (EIA) showed a larger than expected buildup of 6.5 million barrels, when the forecast called for a small drawdown of 1.5 million barrels. Yesterday the API oil inventory report came in with a -2.1 million barrels setting the market for a surprise.

West Texas Intermediate is trading under $70 as crude prices have been hit by the bigger than expected buildup in the US.


West Texas Intermediate graph

Supply and demand have been in the background this week as the disappearance of a Jamal Khashoggi has put the spotlight on Saudi Arabia and not in a good way. The Kingdom does not take criticism lightly and issued some statements that have since been walked back as cooler heads have prevailed.


West Texas Intermediate graph

Iranian sanctions have created supply anxiety and Saudi Arabia as the de facto leader of OPEC has not increased production to the US President’s liking as prices rose. Higher inventories will put less pressure on Saudi Arabia on the supply side, as the diplomatic tension continues to be high ahead of the Future Investment Initiative next week.

Rhetoric and diplomacy will guide the oil market for the remainder of the week as more information is known on the whereabouts of the missing journalist and the different official statements from world leaders on the issue.

U.S. Treasury said to release currency policy report today

The U.S. Treasury Department is poised to release its much-awaited foreign-exchange policy report to Congress on Wednesday afternoon, according to an administration official.

The semi-annual review of currency regimes of the U.S.’s 12 major trade partners and Switzerland will be released on Treasury’s website late in the day in Washington, the official said, declining to provide timing. The person spoke on the condition of anonymity.

Treasury is poised to render a verdict on President Donald Trump’s claim that China is manipulating its currency. While the U.S. hasn’t designated China as a currency manipulator since 1994, Wall Street is bracing for the prospect that Treasury will do so this week. Such a move wouldn’t trigger penalties, but it would likely escalate tensions between the world’s two largest economies.

Bloomberg

Canada: Monthly Survey of Manufacturing, August 2018

Manufacturing sales fell 0.4% to $58.6 billion in August, following three consecutive monthly increases.

The decline was mainly due to lower motor vehicle sales. Excluding this industry, manufacturing sales rose 0.4% in August.

After taking price changes into account, the volume of sales in the manufacturing sector edged down 0.3% in August.

Motor vehicle industry posts the largest decrease

Sales of motor vehicles fell 8.3% to $4.9 billion in August, following two consecutive monthly increases. The decline was mostly attributable to lower production due to atypical shutdowns in some assembly plants in August. In constant dollars, motor vehicle sales fell 8.4%, which shows that the decrease in current dollars mainly reflected a drop in sales volumes rather than lower prices in the industry.

Primary metal industry sales fell 2.9% to $4.4 billion in August, a third consecutive monthy decline. The decrease in August reflected lower sales in the non-ferrous metal (except aluminum) production and processing industry. Conversely, seasonally adjusted sales in the iron and steel mills and ferro-alloy manufacturing, steel product manufacturing, and alumina and aluminum production and processing industries grew in August.

Sales in the wood product (-3.4%) and food (-0.6%) industries also fell in August.

These decreases in current dollars were partially offset by increases in the aerospace product and parts (+13.5%), plastic and rubber product (+3.8%), machinery (+2.0%) and chemical product (+1.1%) industries.

Sales down in three provinces

Sales were down in three provinces in August, with Ontario posting the largest dollar decrease.

After two straight monthly increases, sales in Ontario fell 2.0% to $26.6 billion. The decline was mainly attributable to lower sales in the motor vehicle (-8.9%), primary metal (-8.4%) and motor vehicle parts (-1.8%) industries.

In Alberta, sales fell 0.8% to $6.6 billion, following three consecutive monthly increases. Most of the decrease stemmed from lower sales in the petroleum and coal products (-3.5%), electrical equipment, appliance and component (-24.6%) and primary metal (-9.2%) industries.

The largest monthly increase was in Quebec, where sales rose 1.3% to $14.2 billion. The gain was mainly attributable to an 18.9% increase in the aerospace product and parts industry and, to a lesser extent, gains in the plastic and rubber product (+8.6%), computer and electronic product (+12.2%) and petroleum and coal product (+3.4%) industries.

Inventory levels rise

Inventory levels rose 1.1% to $83.9 billion in August. Inventory increased in 14 of 21 industries, with the largest gains in transportation equipment (+3.4%), food (+1.9%) and plastic and rubber product (+5.6%).

These increases were partially offset by lower inventory levels in the primary metal (-1.4%) and wood products (-2.3%) industries.

The inventory-to-sales ratio rose from 1.41 in July to 1.43 in August. The ratio measures the time, in months, that would be required to exhaust inventories if sales were to remain at their current level.

Unfilled orders increase

In August, unfilled orders rose 0.8% to $94.8 billion, after edging down 0.2% in July. Most of the gain came from a 0.8% increase in the aerospace product and parts industry. Unfilled orders were also up in the computer and electronic product and the fabricated metal product industries.

After two consecutive monthly decreases, new orders were up 1.1% to $59.3 billion in August. An increase in new orders in the aerospace product and parts and machinery industries were behind this gain.

The capacity utilization rate edges up

The capacity utilization rate (not seasonally adjusted) of the manufacturing sector edged up 0.7 percentage points, from 79.5% in July to 80.2% in August. Following a 14.6 percentage point decline in July, the capacity utilization rate for the transportation industry increased from 73.4% in July to 81.5% in August. Shutdowns at several auto manufacturing plants were responsible for the decrease in July.

The capacity utilization rate of food manufacturers fell 2.2 percentage points to 81.0% in August. This decrease was attributable to lower production in most food industries.

The capacity utilization rate of the primary metal industry, which includes aluminum and steel, edged down 0.3 percentage points to 77.8% in August.

StatsCanada